Building a Custom ResultsManager Dashboard
This week I got an inquiry from Sigurdur on whether there was a “Hot Action” ResultsManager dashboard available. I thought it would be useful to capture the process of creating one in a blog post to review the seven steps to creating a custom ResultsManager dashboard using MindManager 7.
Sigurdur’s request was for a “Hot Actions” dashboard that could be synced to Outlook and a PDA that selected tasks based on the following criteria:
- NEXT actions only
- Priority 1
- Explicitly Committed (*committed)
- All Dates
Here are the steps to achieve this:
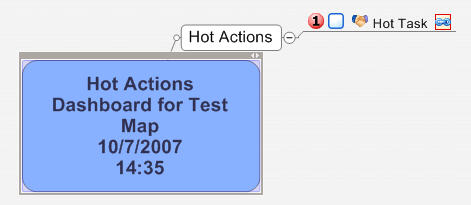
- Create a new blank map (Application, New, Default Map), and add some information and placeholders to the central topic that will tell the user when it was last refreshed and from what map central:

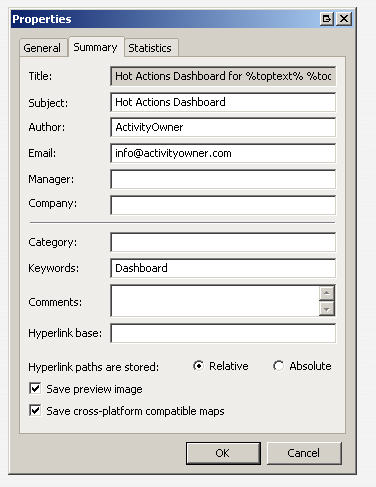
- Set the “Subject” and “Keyword” in the file properties (Application, Prepare, Properties). The “Subject” is the dashboard’s title “Hot Actions” and the “Keywords” needs to be set to “Dashboard”. You can further configure the dashboard to not show parent projects, categories, task info, etc., by visiting the “View, “Show/Hide” menu.
- Build the filters. In this case we need the following:
- Committed*=Y (only select tasks that have a “committed” icon on them explicitly)
- Activityowner=%me% (only select tasks for the current user)
- Activity=X (next actions only)
- Priority=1
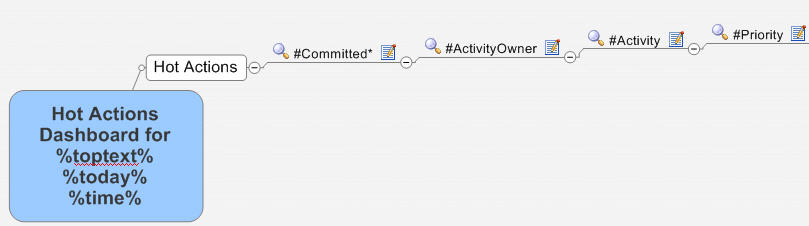
The resulting dashboard will be cleaner if you hang the filters off the main topic rather than the central topic (“Hot Actions”). The magnifying glass icon indicates the topic is a filter rather than a structural topic in the map. The # symbol says to use the entry just as a filter rather than a visible enumeration of its output. You should order the filters to exclude as many items as possible as early as possible in the tree. In this case, the explicitly committed flag is probably the most “rare” entry, followed by the user being the owner of the task.
- Save your dashboard template. You can save it in “My Maps\My Dashboards” or in a separate folder if you would rather keep your custom dashboards in a separate location. I like to save mine as “AO_NAME_template.mmap” with the “template” portion reminding me that this is a template rather than an actual dashboard.
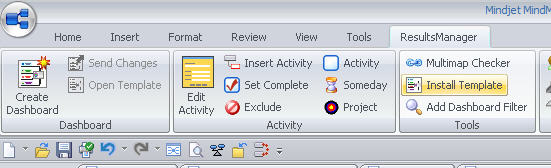
- Install the template by clicking on “ResultsManager”, “Install Template”. The button will be grayed out if you missed something in step 2 or haven’t saved the map.
- Step 6 (under version 6) was to save and close the dashboard template. Under version 7 you can leave it open for further refinement after testing.
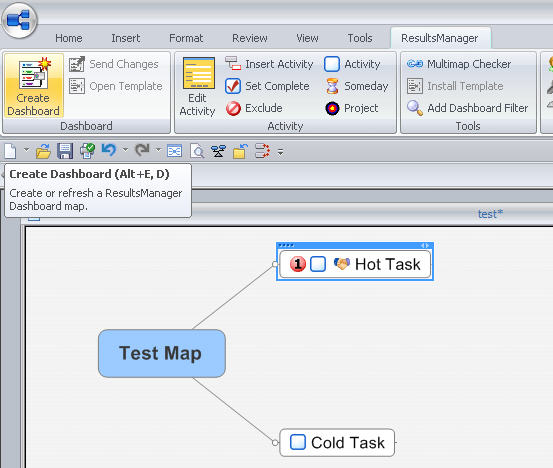
- Test dashboard on a simple map that contains examples of what you are looking for rather than the whole map network by clicking on “ResultsManager”, “Create Dashboard”:
Once you establish that is it working right, you can test it on your “Map Central” and save the resulting dashboard. Once it is saved, you can open it and refresh it directly rather than choosing the “Map Central” and selecting the dashboard template to use.
If you want to change the template, you can open it from the dashboard by clicking on “ResultsManager”, “Open Template”.You can download this “Hot Action” dashboard from the ResultsManager Dashboard Library.


 Entries
Rick said,
December 27, 2007 @ 6:31 pm
Hi,
Thanks for the wealth of information that you provide, on MM, RM, GyroQ etc. You’ve de-mystified creating a RM template such that I’ll have to give it a whirl.
Have a great New Year!
Rick